

5 x Why
This method is used to visualize problems and figure out its cause. Simple improvement measures can be derived from the results.
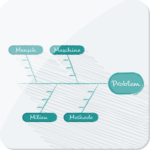
Cause and effect diagram
The cause and effect diagram (also named: Ishikawa diagram) is a classic tool in quality management and is applied for the determination of potential causes for a particular problem.

Data picking list
The data picking list is a tool meant to record failures by type and number. Occurring failures get recorded in a tally sheet. The amount of tallies provides an overview of the frequency of occurrence.
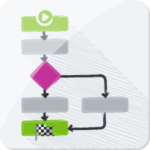
Flowchart
A flowchart visualizes work processes in a graphical form. It outlines consecutive work steps, events, interfaces, and responsibilities. Furthermore, the flowchart is applied to analyze an existing or to illustrate a new process.

Force field analysis
The force field analysis is a useful tool to identify both, factors which bind forces and inhibit or block changes as well as those which release forces and thus promote change throughout change processes.

Problem decision program chart
The problem decision program chart organizes thoughts on existing or planned processes and illustrates the connections graphically, quickly, and clearly. To be able to do so, the process is broken down into substeps. Each problem that can arise within a substep is listed along with a possible solution.

Spaghetti diagram / movement map
Graphical tool for activities of a lean production which is used to visualize work practices and processes to reveal and depict waste at transports and movements.