
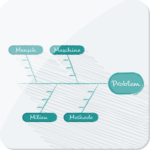
Cause and effect diagram
The cause and effect diagram (also named: Ishikawa diagram) is a classic tool in quality management and is applied for the determination of potential causes for a particular problem.
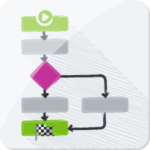
Flowchart
A flowchart visualizes work processes in a graphical form. It outlines consecutive work steps, events, interfaces, and responsibilities. Furthermore, the flowchart is applied to analyze an existing or to illustrate a new process.

Problem decision program chart
The problem decision program chart organizes thoughts on existing or planned processes and illustrates the connections graphically, quickly, and clearly. To be able to do so, the process is broken down into substeps. Each problem that can arise within a substep is listed along with a possible solution.