

Analytical Hierachy Process
The Analytical Hierarchy Process (AHP) is a method often applied in Six Sigma or Design for Six Sigma projects in order to prioritise the client needs ascertained before, for example, by pairwise comparison.

Column-/bar diagram
The column and/or bar diagram is a visualisation method often applied for the primarily visualisation of a frequency scale within a coordinate system by means of columns or bars.
Data collection plan
The data collection plan serves as a tool to display structured requirements designed for the data collection considering the measurands for the data material and to display the specified measurements, processes and responsibilities for the implementation/execution of the measurements.

Macro flowchart
The (macro-) flowchart is a visual depiction of the single steps of a process. This can be used to plan and to analyze a process more accurately.

Measurement matrix
A measurement matrix creates a structured approach to verify potential causes. In the matrix, possible influencing factors are matched with output measurement parameters. The goal is to identify the influencing factors with the likely largest effect on the output quantity and to further analyze them.
Process diagram
A process diagram is a graphical depiction of processes. It describes the temporal and logical order of single process steps and their links. This kind of depiction is often used in enterprises.
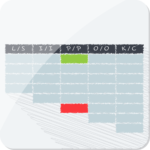
Response plan
The reaction plan is a tool created to react effectively to changes of process results. In the form of a table, it ensures that the people responsible react in a quick and primarily appropriate manner to changes with the right measures at the right time. This guarantees the correct fulfillment of customer needs.

Scatter plot
The scatter plot is a graphical depiction of the coherence of two characteristics. The characteristics are measured and entered as pairs of values.
SIPOC
The process that is to be improved is visualised in a compact shape of roundabout five to seven steps. This leads to a unique perception within the team regarding the total scope of the process being examined. The project range is limited by clear and traceable definitions of the procedural steps and the interfaces towards suppliers and clients.