
These are all tools with complexity "easy"!
5 x Why
This method is used to visualize problems and figure out its cause. Simple improvement measures can be derived from the results.

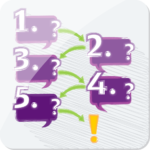
6-3-5
The 6-3-5 method is a creativity tool which is used to generate ideas and find solutions to a clearly defined problem. 6 participants write down 3 ideas each on a sheet of paper in a given time (for example one minute). The sheet is passed to the next participant who is doing the same. In total, the sheet of paper is passed 5 times.

ABC classification
The ABC analysis splits an amount of objects into the classes A, B and C and grades them according to descending significance
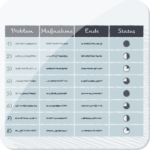
Activity plan
The activity plan is used to depict agreed measures. In addition to classic protocols, the focus is on a clear presentation of concrete measures that are planned to be implemented. Furthermore, it regulates at which time the measures are implemented by whom.

Affinity diagram
How to structure and visualise ideas and/or areas of activity collected during a brainstorming session.

Analysis of stimulus words
When using the analysis of stimulus words, you try to encounter new solutions or creative thoughts by providing key words. These key or stimulus words should help the participants to leave their old lines of thought and guide them to find new links and connections.

Best Practice
Best practice (or excellent practical applications) normally includes methods or techniques that achieve better results than comparable other options. Often, there are listings of excellent methods/processes which demonstrate the most efficient ways to get a specific job done.

Brainstorming/ -writing
Brainwriting / (Anti-) Brainstorming / Brainwalking is a simple, but effective group creativity technique which is used to collect ideas, causes, arguments and solution approaches.
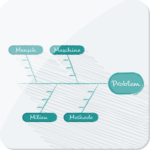
Cause and effect diagram
The cause and effect diagram (also named: Ishikawa diagram) is a classic tool in quality management and is applied for the determination of potential causes for a particular problem.

Change-Kurve
The change curve describes phases of the emotional experience of humans in change processes. Implications for action can be derived from each phase. The change curve serves as a tool to define the current state in the change process as well as to plan next steps and preventive measures.