5 x Why
This method is used to visualize problems and figure out its cause. Simple improvement measures can be derived from the results.

Activity plan
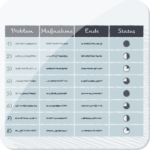
The activity plan is used to depict agreed measures. In addition to classic protocols, the focus is on a clear presentation of concrete measures that are planned to be implemented. Furthermore, it regulates at which time the measures are implemented by whom.

Brainstorming/ -writing
Brainwriting / (Anti-) Brainstorming / Brainwalking is a simple, but effective group creativity technique which is used to collect ideas, causes, arguments and solution approaches.

Cause and effect diagram
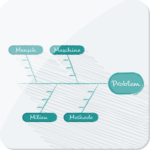
The cause and effect diagram (also named: Ishikawa diagram) is a classic tool in quality management and is applied for the determination of potential causes for a particular problem.

Effort-Benefit-Matrix
The Effort-Benefit-Matrix is used to compare the efficiency of different solution approaches or possible measures.

Spaghetti diagram / movement map
Graphical tool for activities of a lean production which is used to visualize work practices and processes to reveal and depict waste at transports and movements.
