
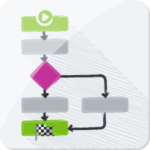
Flowchart
A flowchart visualizes work processes in a graphical form. It outlines consecutive work steps, events, interfaces, and responsibilities. Furthermore, the flowchart is applied to analyze an existing or to illustrate a new process.

Gantt-Chart
Gannt chart is a tool of the project management that shows the time sequence of activities and milestones in the form of bars on a timeline.

Process diagram
A process diagram is a graphical depiction of processes. It describes the temporal and logical order of single process steps and their links. This kind of depiction is often used in enterprises.
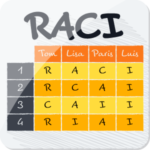
RACI
RACI is a technique that helps with the analysis and depiction of responsibilities. The name is an acronym of the English terms Responsible, Accountable, Consulted, and Informed.
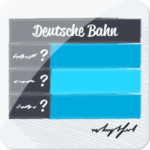
Response plan
The reaction plan is a tool created to react effectively to changes of process results. In the form of a table, it ensures that the people responsible react in a quick and primarily appropriate manner to changes with the right measures at the right time. This guarantees the correct fulfillment of customer needs.
SIPOC
The process that is to be improved is visualised in a compact shape of roundabout five to seven steps. This leads to a unique perception within the team regarding the total scope of the process being examined. The project range is limited by clear and traceable definitions of the procedural steps and the interfaces towards suppliers and clients.

Swimlane
A swim lane is a visual element which is used in process flow diagrams or flowcharts to visualize the responsibilities for sub-processes of a business process.

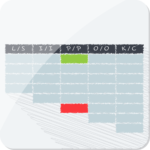
Time analysis
The time analysis represents a helpful method to quantify single process steps during an analysis.