

5 x Why
This method is used to visualize problems and figure out its cause. Simple improvement measures can be derived from the results.
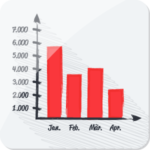
Column-/bar diagram
The column and/or bar diagram is a visualisation method often applied for the primarily visualisation of a frequency scale within a coordinate system by means of columns or bars.

Data picking list
The data picking list is a tool meant to record failures by type and number. Occurring failures get recorded in a tally sheet. The amount of tallies provides an overview of the frequency of occurrence.

Force field analysis
The force field analysis is a useful tool to identify both, factors which bind forces and inhibit or block changes as well as those which release forces and thus promote change throughout change processes.

Macro flowchart
The (macro-) flowchart is a visual depiction of the single steps of a process. This can be used to plan and to analyze a process more accurately.

Six thinking hats
Mit Hilfe dieser KreativitätstechniWith the aid of this creativity technique different directions of thought can be pursued systematically. This technique may be applied by a group as well as a single person.k werden systematisch unterschiedliche Denkrichtungen zu einer Fragestellung eingenommen. Diese Methode kann in einer Gruppe oder von einer Person angewandt werden.

Spaghetti diagram / movement map
Graphical tool for activities of a lean production which is used to visualize work practices and processes to reveal and depict waste at transports and movements.